
NeuraSection v2020 Released with Multiple New Features
Our team at Neuralog is proud to announce the latest release of NeuraSection, our geological interpretation and well correlation system. NeuraSection brings raster and LAS well logs together so you can correlate them, pick tops, and build cross sections, maps and presentation montages in one application.
Cross sections can be viewed in two interpretation modes. Stratigraphic mode hangs the wells on a chosen marker and flattens it, so you can see thickness changes, pinch-outs and how layers relate from well to well. Structural mode shows each well at its true elevation, so you can see dip, faults and the shape of the structure. You can switch between the two at any time.
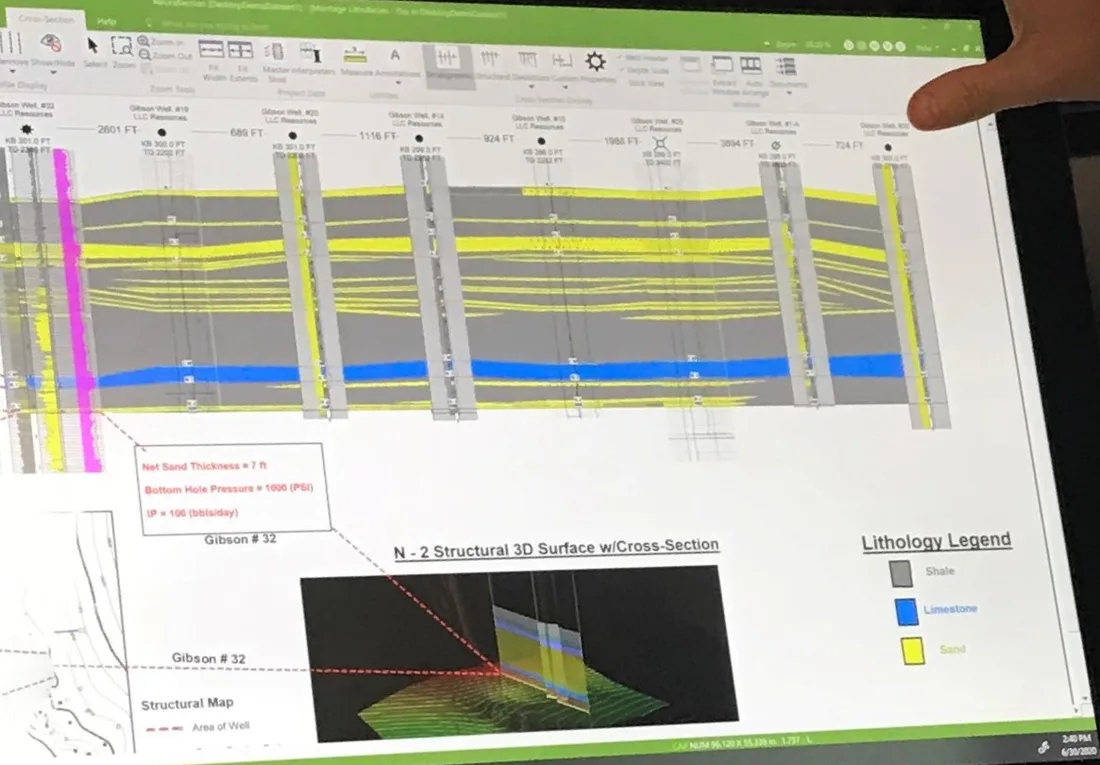
With the v2020 Release of NeuraSection there are a number of New Features and Enhancements.
Visit our Support Page to view the NeuraSection Latest Release Notes or to Request a NeuraSection Update.

Well / Log Data Import and Export
The 2020 version of NeuraSection now supports the GeoGraphix WellBase V4 format for import as well as export. This input format adds to the existing supported formats of PETRA, IHS, ASCII, Excel, and others. Data export formats include PETRA, ASCII, MJ Systems LogSleuth, GCS Wells and Tops.
Enhanced Hot Keys
To help increase work efficiency, we’ve added the list of all Hot Keys in NeuraSection. Go to the Help tab > Hot Keys to access this feature.
License Reminder Message
To ensure uninterrupted access, users of NeuraSection will now see a reminder message beginning 60 days prior to the NeuraSection software expiration date.
UWI Formatting Options
NeuraSection now supports US 14-digit API well number (US Well Number) formatting. This option is fully customizable for any UWI (Unique Well Identifier) and instructions can be found in the NeuraSection Users Guide.
Additionally, API/UWI formatting by ‘Display Dashes’ is available in all windows and views. Learn more about well numbers from this easy-to-understand blog post (opens in a new tab) from Enverus (formerly Drilling Info).
Improved User Experience
NeuraSection v2020 adds improved integration with other Neuralog software applications. For a seamless experience at startup, NeuraSection will open with the last saved visual product theme. Functionality has also been improved with updated tooltips in the user interface.
A Redesigned NeuraSection Interface
Originally published on the Neuralog blog in 2020, along with the feature sections that follow.
Over the last year, NeuraSection has been redesigned to have fewer menus, added touchscreen technology, and more upfront features that were previously hidden to help you identify what you are working on and quickly get through your workflow. This change was made to adapt to the many ways that geoscientists learn and use not only words, but symbology, images, models, and diagrams. The NeuraSection interface has also been customized to allow users the power to create their own personalized workflows in our software. NeuraSection’s Project Explorer makes it easier to switch and visualize information across projects without leaving the project you are working in. All of these changes are designed to enable you to be more productive and more comfortable with the software.
Graphical User Interface (GUI) Enhancements
Experienced NeuraSection users, on startup, will immediately see that the Graphic User Interface (GUI) looks different from the old version. New users or professionals looking for a new solution can immediately tell that this interface resembles the MS Office ribbon with the Start Page. The new Start Page is designed to give the user information about who the active interpreter is, which project was last active, what items were worked on last, as well as, functions to begin work right away.
The new ribbon interface is a graphical representation of your work items and selections rather than menus. Users will notice that each tab is a specific category that corresponds to the document types in NeuraSection. In NeuraSection, we have created what we call Smart Ribbon Technology. This means that when a document is opened NeuraSection detects what type it is and will automatically open to the appropriate Tab for that doc type. This technology allows the user to continue working on their documents without the tediousness of switching back and forth.
Curve Data Import Tool
The new Curve Data Import Tool is especially helpful if your data isn’t in LAS format. It imports custom table data from Excel, ASCII, CSV and TXT files and converts it into LAS curves.
Different professionals record their data in many different ways. Some users and companies don’t have access to LAS data, and others record their measurements in their own formats so they can run their own proprietary algorithms on them. With the Curve Data Import Tool, that data doesn’t have to be retyped or converted by hand: NeuraSection generates the LAS curves, which can be assigned to a geographic location and displayed and correlated with the rest of your logs.
Optical Character Recognition (OCR) Tool
Typing has become a daily task for everyone and as a result, our hands tend to get tired after extended periods. One solution to help solve this pain point is our OCR tool. Users can quickly select sections of a log header and capture information to populate the database rather than typing it all by hand. This can also be useful for capturing remarks in a well log to copy/paste them in the remarks section of the properties of the well.
Deviations View
Deviations View adds a quick switch between TVD (true vertical depth) mode and deviated mode, so you can move back and forth while you work with logs and make surface picks.
This matters because a deviated well crosses formations at an angle. A log records depth along the borehole, so in a deviated well a formation can look thicker than it really is. In TVD mode, depths are corrected to true vertical depth, so the thickness you see reflects the formation rather than the angle of the well. Switching between the two views keeps you from mistaking a thickness change caused by the well path for a real stratigraphic thickness change when you pick tops.
Area of Interest (AOI) Enhancements
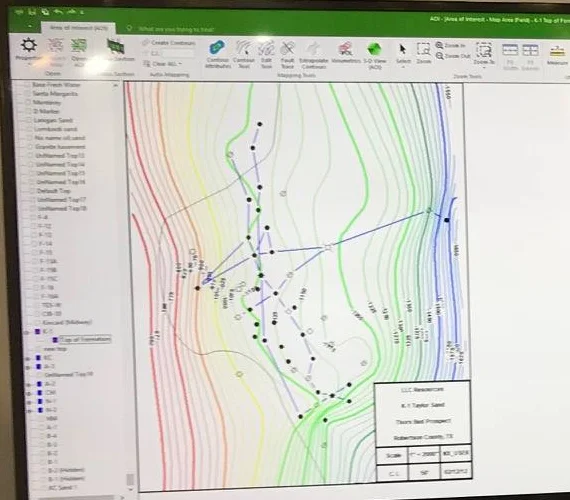
The Area of Interest (AOI) is where you build maps in NeuraSection. Create an AOI from your project map, then generate structure, isopach and other contour maps from formation tops or any other well data in a few clicks.
Several mapping features that were once buried in dialogs are now on the ribbon. You can redraw contours with a different contour interval on the fly, for more detail or a cleaner overview of the same surface, without rebuilding the map. Contours can also be drawn by hand, edited, or given gradient or discrete color fills for presentation.
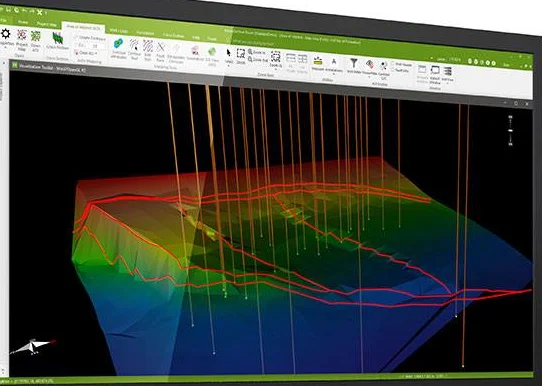
The quick 3D tool, also now on the ribbon, shows your contoured surface as a 3D map with the wells in place. Seeing the structure in 3D makes it easier to spot highs, lows and trends, and to check an interpretation before you present it.
One of the issues in some software packages is the limitation of data the user can contour. In NeuraSection you can quite literally map on anything you wish. You can map things like Water Saturation Data, VClay, Production in different intervals, Perforation flow rates, permeability data or any other data you may have in spreadsheets. NeuraSection requires a UWI, Lat/Long or X/Y location, a value to map, and the desired contour interval. As the data gets mapped, it belongs to the surface the user created it on.
Built-in volume and reserves calculators work from these maps: select a formation to estimate volumes and display a report of contour values and areas, ready to drop into your montage.
Touch Interface
The new Ribbon interface gives the user graphical representations of the work task they wish to perform. Examples include connecting and disconnecting the tops, removing and adding the color fills, changing between Stratigraphic and structural mode and zooming in and out with just the fingers.
We enable the user to use touch screen technology to pick tops, faults, unconformities, contours and other functions in NeuraSection. The project map now has improvements to be touch friendly. To activate the larger interface, go to the far left of the Home / Help tab and select touch mode.
NeuraSection is one of the integrated modules of Neuralog Pro, an all-in-one system (currently available for users in Canada and the U.S.), providing access to all Neuralog software modules in one subscription license. With Neuralog Pro you can organize your data efficiently and accurately to streamline your entire E&P workflow. Ideal for independents and enterprises that need quick, easy access to their geological data.
Contact us for more information on NeuraSection and how its powerful workflow wizards will help you display and evaluate all available geological data to create presentation logs, maps, cross-sections, and prospect montages.
Team Neuralog