
NeuraSection
Integrated Geological Evaluation

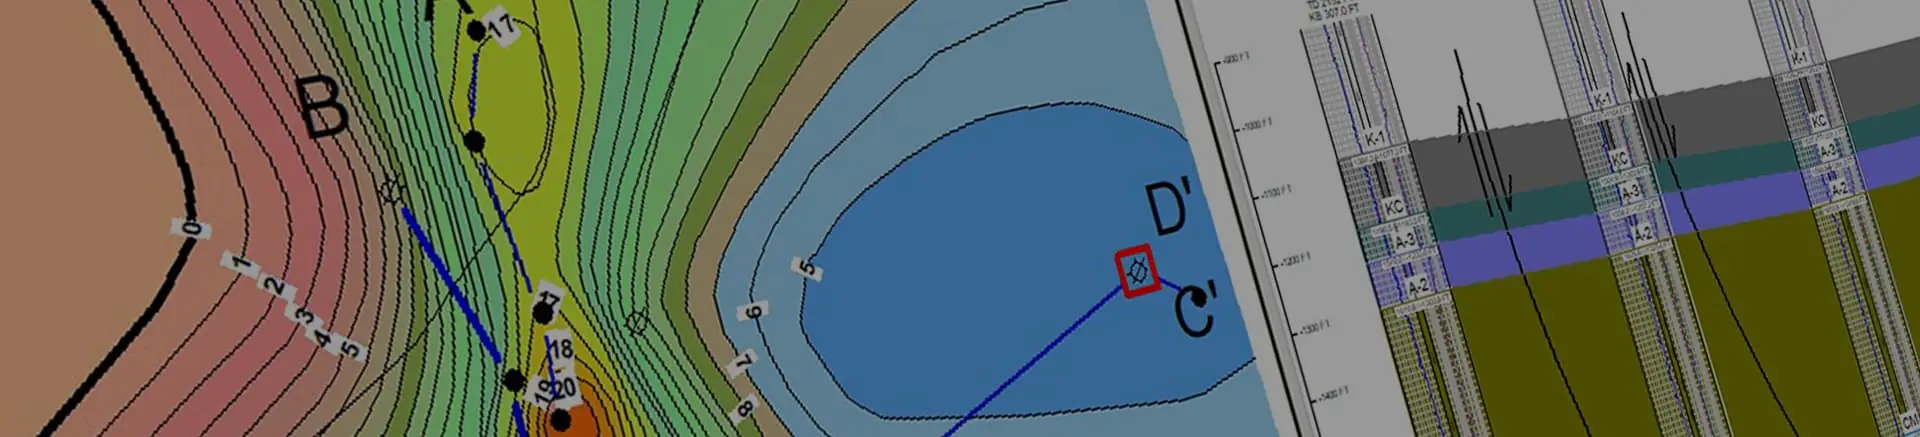
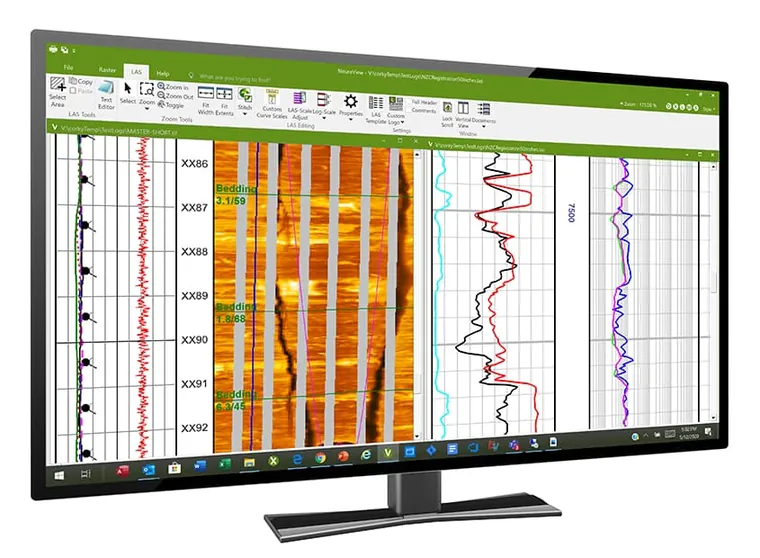
NeuraSection is the only geological interpretation system available with the image quality to truly support raster and digital well log correlation, cross-section creation, and analysis. NeuraSection uses your existing log images and digital files and autoloads them to the database or format you need to become your integrated interpretation solution.
Read more about NeuraSection on our blog:
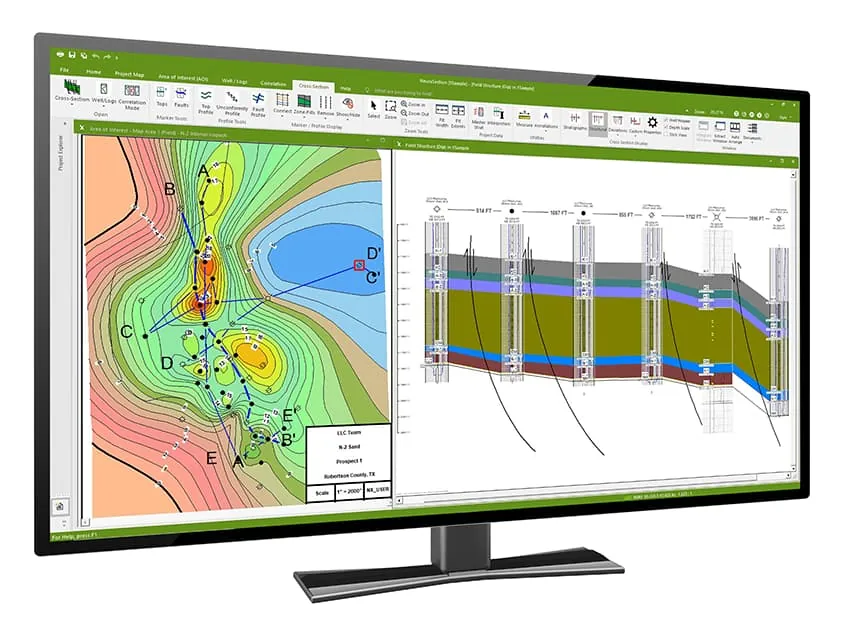
NeuraSection allows you to evaluate and display all available geological data. Users can visualize, analyze and create presentation logs, maps, cross sections, and montages, as well as delineate reserves, in a process that maximizes data resources and minimizes the time required to create and present the total play concept.
“NeuraSection is the Desktop Interpretation Tool that geologists have been waiting for… NeuraSection saves time and cuts costs, while creating superior, presentation quality products. …The guys at Neuralog have done a great job!”
F. Reid, Providence Oil Company
Correlation
Log Correlation can be done in log-to-log mode or in the cross section. Any depth calibrated log is ready for correlation with manual picks or auto-posting of imported picks.
Flexible Well Log Correlation Options
- Click to correlate down the stratigraphic column or across multiple logs
- Optionally correlate multiple wells simultaneously using even thickness model
- Correlate in measured depth or true vertical depth
- Align well log views on Structural or Stratigraphic datums
- Switch between correlation in cross sections and log-to-log, as needed
- Mark formation tops and bases with “lock to depth” option
- Add fault markers with type and missing or repeat sections
Individual logs may be marked and annotated to create a show log for your working reference, final presentation, or inclusion in the montage.
Show/Work Log Displays
- Display tops, bases, faults, etc.
- Create composite logs using multiple raster/LAS logs and annotate to make type logs
- Display show, perforation, core, IP, DST data, production data tables and cumulatives
- Post formatted detailed user text
- Place Windows bitmap and metafile graphics; library lithology, engineering, and geology graphics included
- Annotate with user-defined freeform drawing/filling
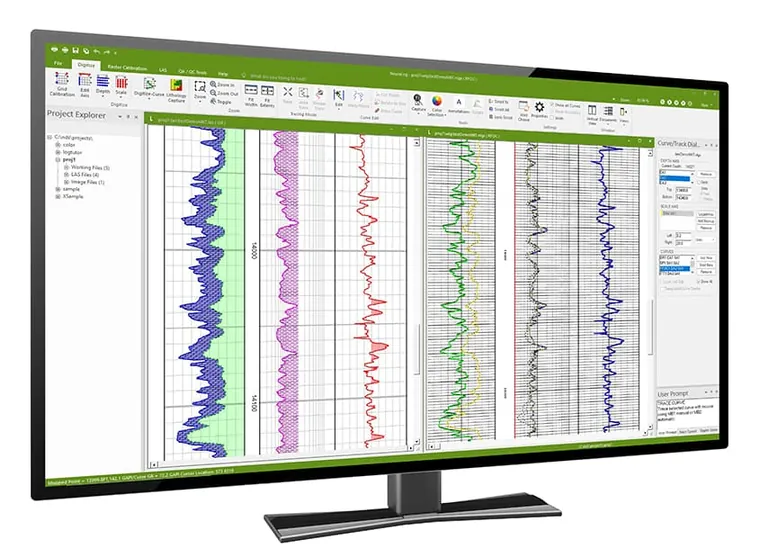
LAS Well Log Presentations
- Create custom templates for track, scale, color, line type, backup, etc.
Counting Tool
- Click and drag over the interval for instant counts
- Create lithologic, fluid or user-defined interval counts
- Color and pattern fill intervals
- Auto-post counted interval data on maps and export for other users/applications
Well Diagram
- Shows log types and depth intervals for one or many wells as selected
Mapping
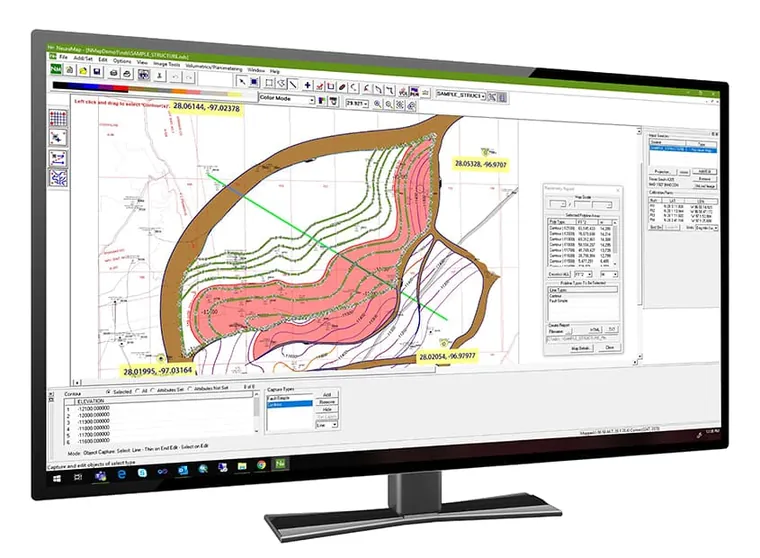
Mapping for various types of geological maps including Top of Formation, Thickness, Net Isopach, etc.
Auto Contouring
- Generate contours for multiple maps within the same “Area of Interest” AOI
- Add gradient or discrete fills to the contours to enhance presentation mapping
Real-time Editing
- Full editing control of computer generated contours and points
- Add your interpretation to computer generated results
- Manually add and edit contours in your workspace for a more complete analysis
Maps
A reference map may be imported or created on-the-fly from well location data. Maps of your “Area of Interest” (AOI) can be created to post values, contour, calculate volumetric reserves and annotate for presentation.
Maps For Reference
- Post well status and header information
- Select wells from map to create cross sections
- Display map image, geotiff or vector map layers
- Apply well filter to remove unwanted wells from view
Maps For Evaluation
- Work with multi-level map management system based on stratigraphic column
- Post top, net gas, sand, or any rock or fluid parameter you have picked
- Create contours using NURB technology
- Create simple faults or fault polygons using optional throw, heave, and dip calculations
- Create displacements across faults
- Display single maps or overlay several maps for referral and integration
- Calculate volumetric reserves from structure or stratigraphic maps and create reports
Cross Sections
Geological Cross Sections are an integral part of NeuraSection, and any number of structural or stratigraphic cross sections can be created and saved.
Well Log Displays Normalized
- Display logs with English or metric depth scales in any vertical scale and width, regardless of original
Deviated Wells Displayed in Cross Section
- Enter geological survey information manually or import from another data source
- Display corrected logs in True Vertical Depth
- Display log images and LAS along wellbore path, even for horizontal wells
Cross Section Views Automatically Generated
- Create cross section templates that control every aspect of the display
- Switch between Structural and Stratigraphic views
- Rehang on any Stratigraphic Datum to create new view
- Space wells equidistant, geo-proportional or custom
- Swap order of logs or order of wells
Composite Log Presentations for Wells with Multiple Logs
- Drag and drop logs in desired order in the cross section
- Merge digital and raster data
- Crop out undesired tracks
- Merge multiple log runs into the same presentation
Faults and Top Profiles
- Shape profiles and use optional contour intersections from the evaluation maps
- Create custom profiles with colors, fills, patterns and line styles
- Connect fault profiles to fault markers in the wells or draw fault profiles independently
- Break top profiles with faults and create displacements across the faults
- Restore missing sections in wells for stratigraphic cross section displays
Quality Improvement
Quality Improvement is a part of all Neuralog products. In NeuraSection this is primarily achieved through the integration with the full Neuralog Professional Suite where data is captured and validated. There are some critical quality control functions within NeuraSection as well.
- Well Diagram shows log types and depth intervals for one or many wells to locate missing data
- Well spots are color coded in your map to indicate wells with missing logs
- Well Filter lets you search on and inspect wells of specified criteria
- Log List View tracks which logs have been calibrated and which have attributes set
- Bubble Map shows you how well your interpretation matches top picks
- Line of Intersection shows you how well your contour map matches the interpretation in the cross section
Montage
NeuraSection has full montaging capabilities to complete your evaluation process. Presentation quality montages can be created with your geological data to sell your prospect play. Logs, maps, and cross sections can be added to the montage, along with any other windows graphics such as core photos, spreadsheets, well reports, etc. “Drag-and-drop” placement makes it easy to add documents and images to the montage. Once complete, the montage can be sent to any printer/plotter or saved as TIFF or JPEG files for inclusion in other Windows applications like Word, PowerPoint, or Outlook email.
ESRI GIS-based Interface
Start your evaluation from an easy to view GIS based interface. The interactive display allows users to select logs from wells displayed on the map layer and quickly correlate logs or create cross sections.
- Display and open cross sections, AOIs and wells from any NeuraSection project
- Area tree for quick well and well log recognition
- NeuraSection toolbar is integrated to allow users to quickly create or edit projects
- Manage projects and well logs across your corporate workspace.
SYSTEM REQUIREMENTS NeuraSection* | |
|---|---|
| Minimum Requirements | |
| Supported Operating Systems | Windows 10 and Later |
| Processor | i5 Processor |
| RAM | 8GB RAM |
| Video Card Memory | 512MB |
| Disk Space | 350MB |
| Screen Resolution | 1920×1080 resolution |
| Other | Support for both SQL and Access databases |
*Specifications subject to change.
Source: https://www.neuralog.com/product-sheets/neuralog-products-solutions.pdf (opens in a new tab)
Looking for Support?
Featured Products
More Information: