
Raster vs. Digital Well Logs: What a Raster Log Is and How It Becomes a LAS File
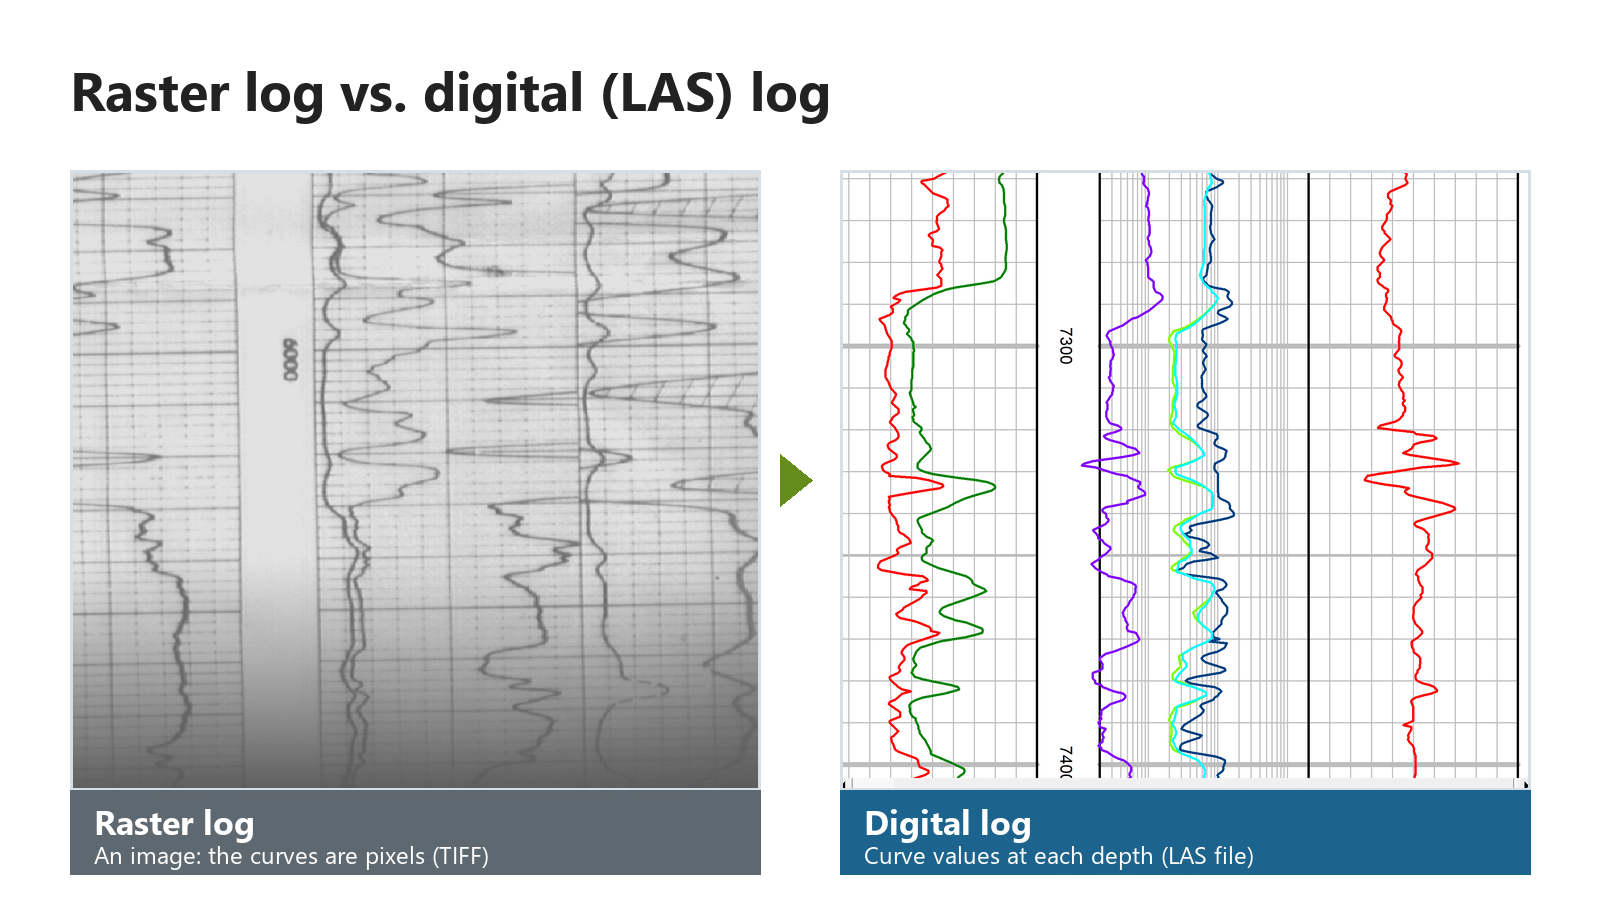
A raster well log is a picture of a log: a scanned image of the paper or film original, with the curves stored as pixels. A digital well log stores the curve values themselves, usually in a LAS file, as numbers at each depth. To turn a raster log into a LAS file, the image is depth-calibrated, its curves are traced, and the values are checked and exported.
This post explains both formats, how they compare, and what happens at each step of the conversion.
What is a raster well log?
A raster well log is a digital image of a well log, made by scanning the paper or film original. It looks exactly like the printed log: the header, the depth track, the grid and every curve. But a computer sees only colored pixels. A raster image preserves the visual information in a well log, but its curves are not stored as structured numerical data. Digitization converts the curves into depth-indexed values that can be used for calculations, interpretation and data exchange.
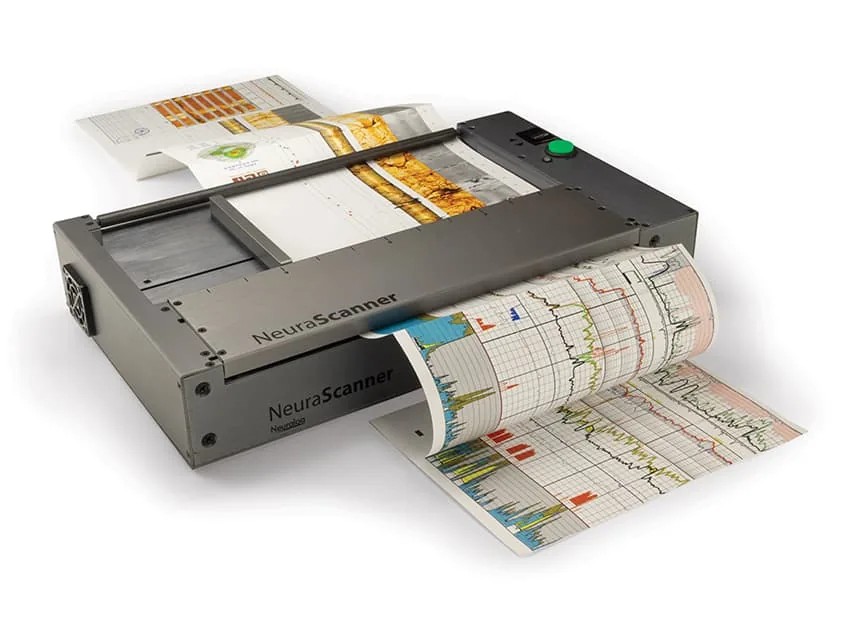
Raster logs are usually stored as image files such as TIFF. Older logs are often long, continuous strips of paper, so a raster log can be a very tall image. A continuous scanner such as the NeuraScanner captures the whole strip in one pass, in color, grayscale or black and white.
Raster logs are still useful on their own. Geologists can view them, line them up beside other wells and mark tops on them. NeuraLog can also produce straightened, depth-registered raster images for geological applications.
What is a digital (LAS) well log?
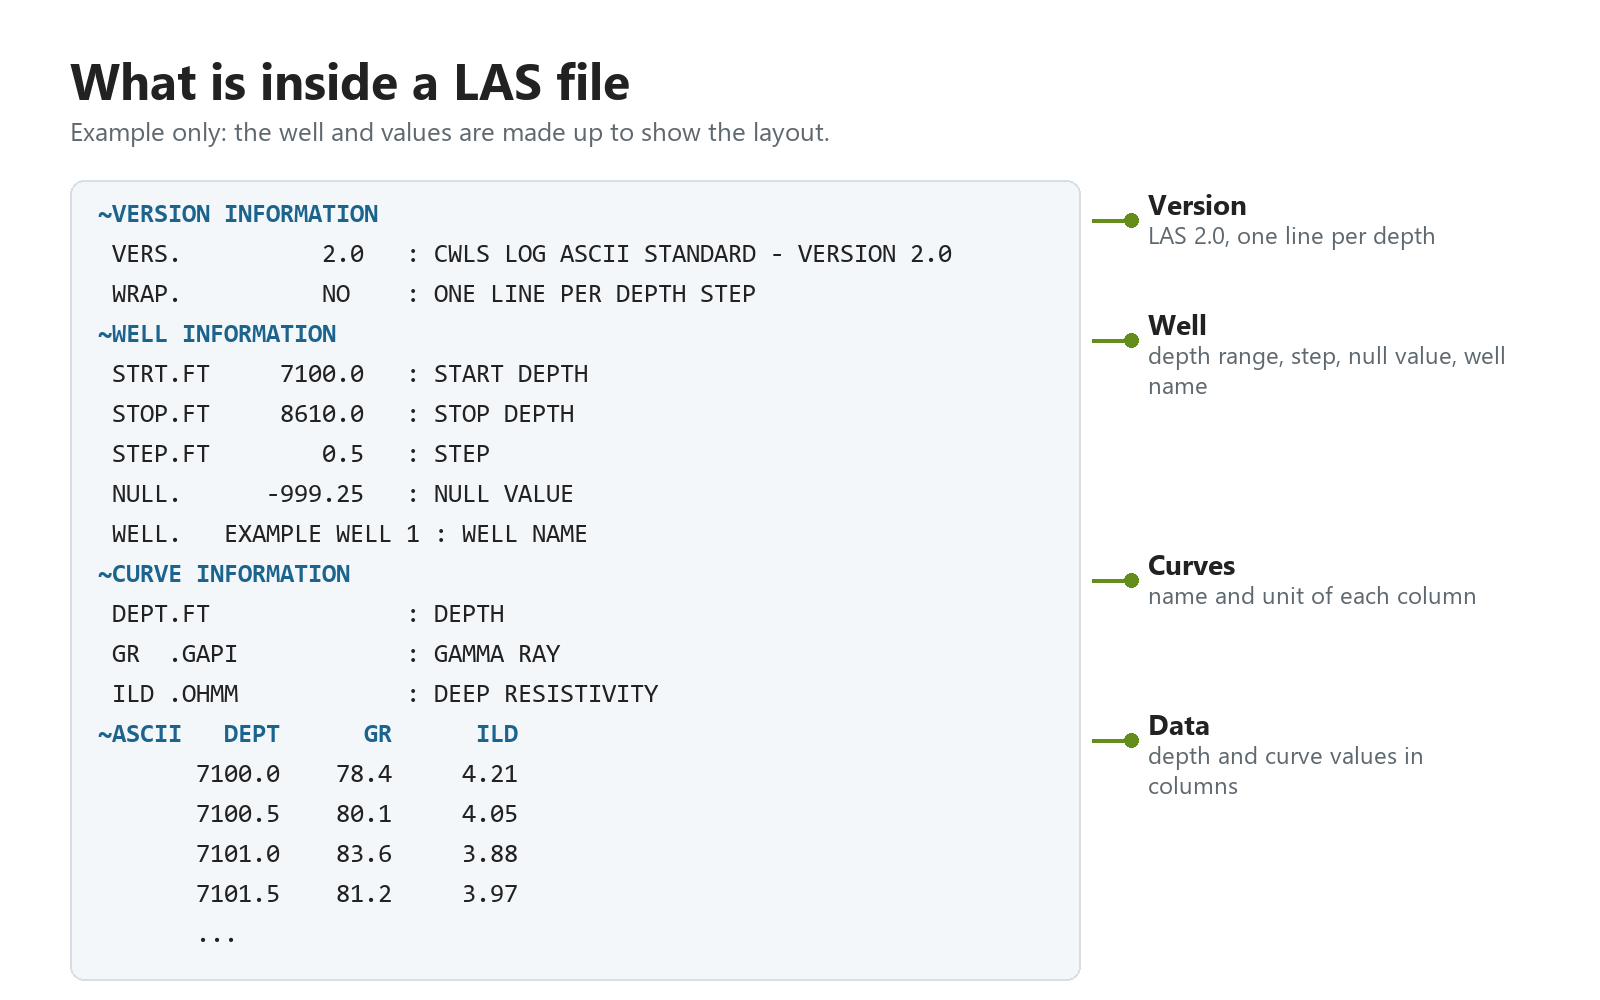
A digital well log stores each curve as a list of values, one per depth step. The most common file format is LAS, short for Log ASCII Standard. The standard is defined and maintained by the Canadian Well Logging Society (CWLS); the U.S. Geological Survey (opens in a new tab) summarizes the format. A LAS file is plain text: a header section describes the well and each curve (name, unit, description), and a data section lists depth and curve values in columns.
Because the values are numbers, software can use them directly. You can load a LAS file into interpretation software, plot curves at any scale, calculate properties such as shale volume or porosity, and compare wells. NeuraLog exports LAS versions 1.2 and 2.0, as well as IHS PETRA ASCII well data and PETRA log image calibration (ILC) files.
Raster vs. digital well logs at a glance
| Raster log | Digital (LAS) log | |
|---|---|---|
| What it stores | A picture of the log (pixels) | Curve values at each depth (numbers) |
| Typical file | TIFF or another image format | LAS (1.2 or 2.0) |
| Made by | Scanning the paper or film log | Digitizing a raster log, or recorded digitally at the well |
| Can software read the values? | No, not until it is digitized | Yes, directly |
| Good for | Viewing, archiving, correlating by eye, keeping the original look | Calculations, crossplots, mapping, loading into interpretation software |
| Keeps the header and notes | Yes, as part of the image | Only what is typed or captured into the LAS header |
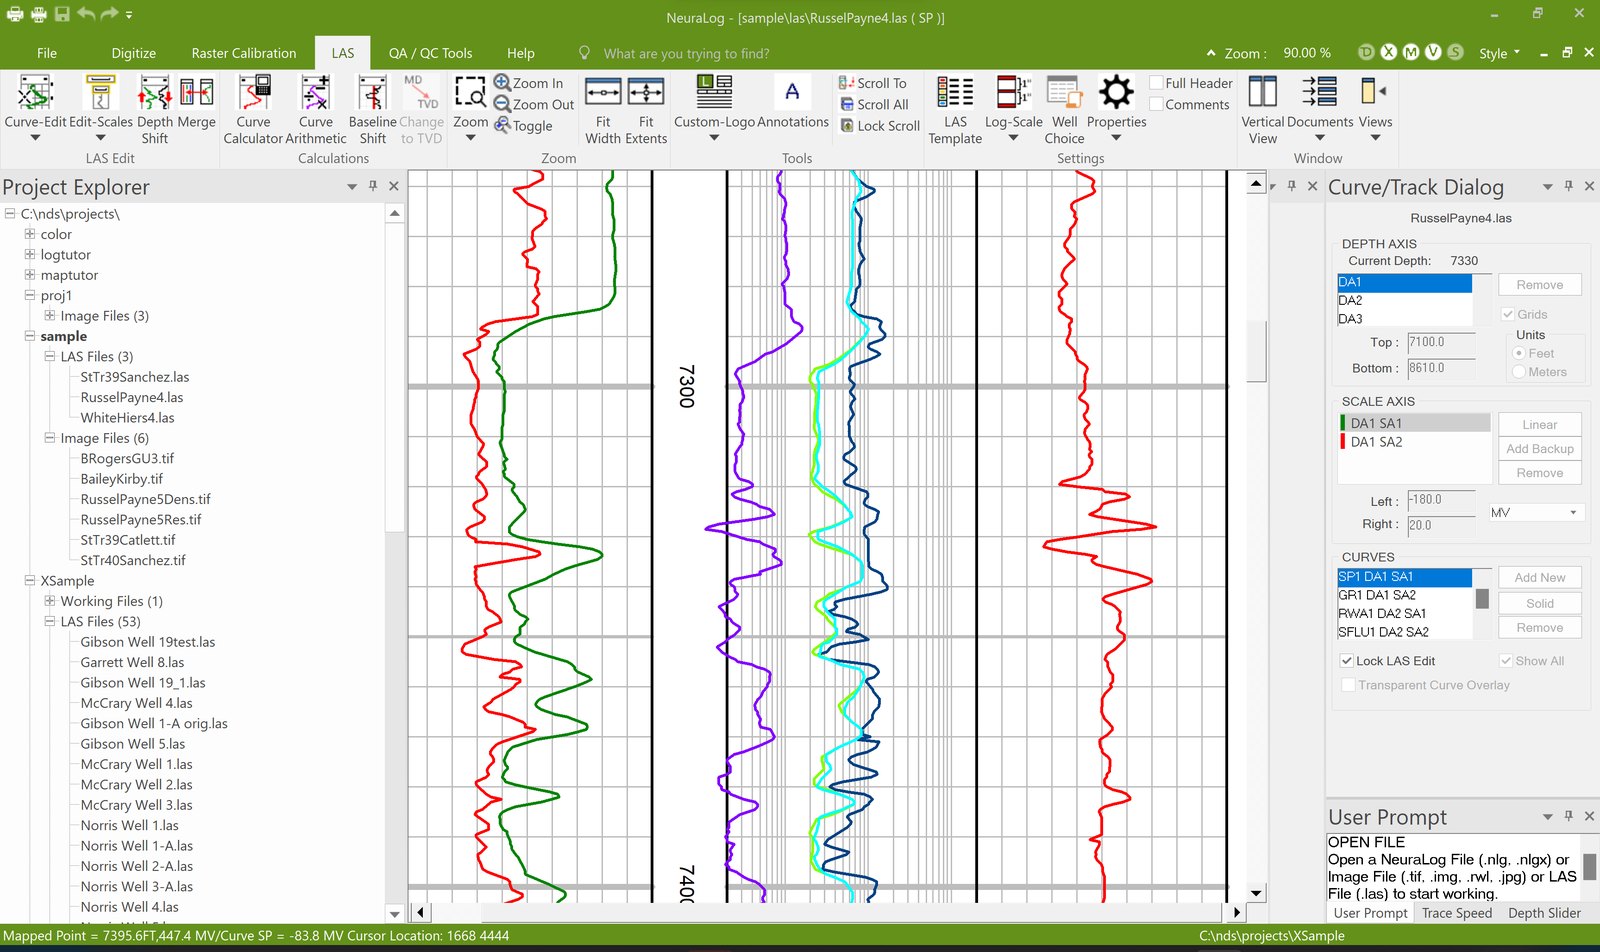
Most teams keep both: the raster log as the record of the original, and the LAS file for analysis. NeuraLog’s Virtual Light Table overlays the two, so you can see that the digital curves match the image.
Why raster logs still matter
For decades, well logs were printed on paper or film. Those logs describe subsurface formations, including rock type, porosity and permeability, and many wells have no other record. Paper is hard to store, search and share, and it fades and tears with age and handling.
Scanning protects the original and makes it easy to view on screen. Digitizing goes one step further: it turns those old logs into data you can use alongside modern digital logs, without re-logging the well.
How a raster log becomes a LAS file
Digitizing a raster log takes five steps. In NeuraLog, most of the tracing is automated, and you check and correct the result.
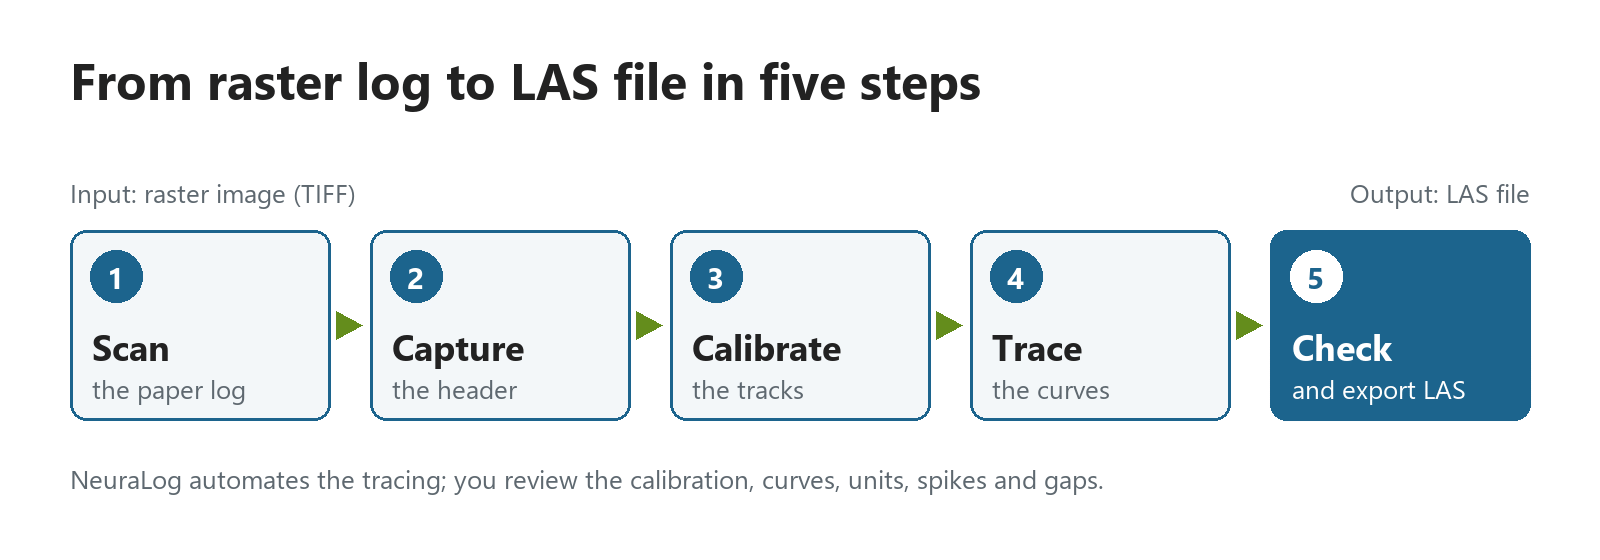
- Scan the log. Get a clean, even image. Set brightness, saturation and threshold so the curves are clear along the whole log; lighter sections can be rescanned. A few extra minutes here can save hours of digitizing later.
- Capture the header. Record the well name, location and curve details. NeuraLog 2026 uses AI-powered OCR to read the log header and fill in key fields, which you then verify.
- Calibrate the tracks. Define the depth grid so every pixel row maps to a depth. NeuraLog finds the grid lines automatically once you mark the first interval. Grid lines must be at even intervals. NeuraLog also corrects warp and stretch in the image from the depth grids.
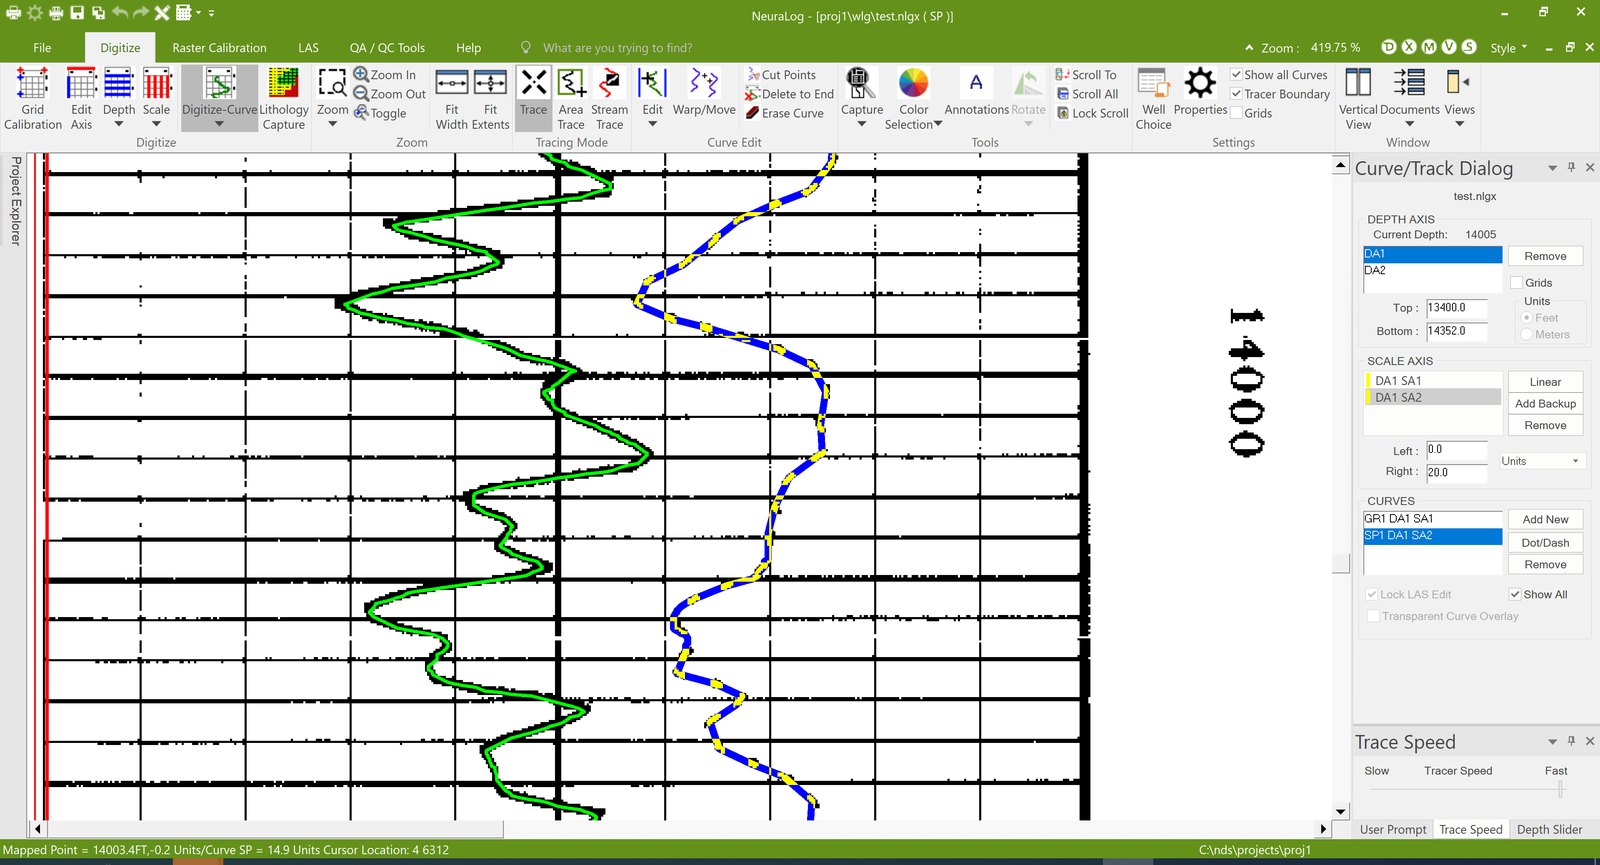
- Trace the curves. Neural-network tracing follows each curve and handles curves that cross the grid and backup scales. NeuraLog’s AI log feature extraction (AILFE) separates curves, grids and background, which helps on faded or dashed curves.
- Check the data and export LAS. Quality tools flag spikes, gaps, pixel overlay and depth-grid problems, and give the log a Log Quality Index (LQI) score. After corrections, export a LAS file and compare it with the image on the Virtual Light Table.
Automated tracing reduces manual work, but the resulting data should still be reviewed. Before you use the LAS file for interpretation or calculations, check the depth calibration, curve identification, units, spikes and gaps. NeuraLog’s Log Quality Index and Virtual Light Table make that review faster, because they show where the digital curves and the image disagree.
For scanning and depth-grid details, see 15 Easy Tips and Tricks for Delicate Well Log Capturing and Defining Depth Grids Using NeuraLog Software.
Common problems when digitizing raster logs
| Problem | What it does | How NeuraLog handles it |
|---|---|---|
| Faded or uneven scans | Curves are hard to trace in light sections | Rescan with adjusted settings; AILFE isolates curves from the background |
| Warped or stretched images | Depths drift along the log | Warp and stretch correction from the depth grids |
| Curves that go off scale (backup or wrapped scales) | One curve appears in several pieces | Tracing on unlimited backup scales, joined into one curve |
| Curves crossing grid lines | Tracing jumps to the grid | Built-in grid model |
| Spikes and gaps | Bad values in the LAS file | Quality tools flag them for correction |
| Several runs of one curve | Split data | Curve splicing merges runs into one LAS file |
Frequently asked questions
What is the difference between a raster log and a LAS file?
A raster log is an image of a well log. A LAS file holds the curve values as numbers at each depth. Software can calculate with a LAS file, but it can only display a raster log until the log is digitized.
What does LAS stand for?
LAS stands for Log ASCII Standard. It is a plain-text file format for well log data, with a header that describes the well and curves, followed by columns of depth and curve values.
Can I convert a scanned well log to LAS?
Yes. Well log digitizing software such as NeuraLog calibrates the tracks, traces the curves and exports the values as a LAS file.
Can I keep the original raster image after exporting to LAS?
Yes, and you should. Exporting a LAS file does not change the image, and NeuraLog keeps the original log image, the digitized curves and the well information together in the project. The raster image is the record of the original log, including notes and headers that a LAS file may not hold. It also lets you check the digital curves against the image.
How long does it take to digitize a well log?
It depends on the log’s length, condition and number of curves. A clean scan saves the most time: poorly scanned logs can add hours of work.
Can a raster well log be used for calculations?
Not directly. Software can display a raster image, but it cannot read curve values from pixels. The curves first have to be digitized into depth-indexed values, such as a LAS file. A raster log is still useful for visual work, such as correlating wells by eye and picking tops.
Does digitizing a raster log guarantee the original values?
No. Digitized values are only as accurate as the scan, the depth calibration and the curve tracing. Faded curves, warped paper or a wrong scale can introduce errors. Check the digital curves against the image before you use them; NeuraLog’s Virtual Light Table and Log Quality Index are built for that check.
Turn your raster logs into data. NeuraLog helps transform scanned well logs into structured LAS data through automated curve extraction, depth calibration and quality-control tools. Combined with the NeuraScanner, it supports a workflow from paper log scanning to digital data. Contact us to see it on your logs.
Related reading